AI Revolution Drives Up Energy Consumption, Global Electricity Bills Soar
Jakarta, CNBC Indonesia - The rapid development of data centers and the massive adoption of artificial intelligence (AI) are currently having a significant impact on energy needs.
Between 2010 and the early 2020s, global data center electricity consumption was relatively stable, accounting for approximately 1% to 1.5% of the world’s total electricity supply.
However, the emergence of generative AI models and Large Language Models (LLMs) has transformed commercial computing architecture, triggering an exponential surge in physical energy demand, which is projected to reshape global electricity infrastructure by the middle of the next decade.
Shift in Computing Architecture
The root of this escalating power demand lies in the fundamental differences between conventional commercial computing and AI processing. AI-based generative search or command processing consumes up to 1,000 times more electricity than standard web searches.
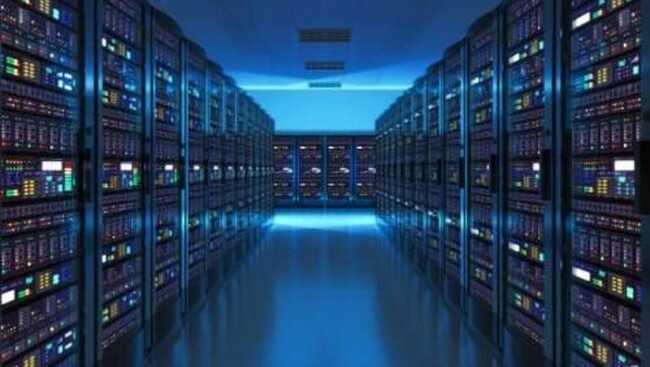
Conventional data centers operate with thermal designs that handle power loads of 5 to 15 kilowatts (kW) per server rack. Currently, facilities specifically designed for AI infrastructure require a minimum of 40 kW of power, and often exceed 100 kW per rack.
This increase in power density is continuous, as the AI model training phase requires tens of thousands of synchronized Graphics Processing Units (GPUs) operating continuously at 100% utilization for months.
Furthermore, the user implementation phase is also projected to dominate and exceed the training load as AI adoption expands across various industrial sectors by 2030.
Here is a revised draft of the calculation section using specific inflection point modeling explanations for each scenario. You can copy and paste this text and table directly to replace the calculation subheading in the previous article.
Dynamic Growth Rate Calculation
In projecting data center energy consumption up to 2035, the growth curve does not move linearly. A combined analysis of Goldman Sachs’ medium-term projections and the International Energy Agency (IEA)’s long-term equilibrium indicates a two-phase growth model.
The first phase is characterized by massive expansion in AI infrastructure development, followed by a plateau phase due to various fundamental adjustments in the industry.
The inflection point in the growth rate for each scenario varies, as it depends on assumptions regarding technical and physical constraints:
- High Efficiency Scenario (Inflection Point in 2027):
This scenario relies on breakthroughs in semiconductor hardware efficiency. Using a moderate growth rate of 14% per year in the initial phase, the curve is projected to begin to level off significantly in 2027 as new generation chip architectures dominate the market and successfully reduce the Joule-per-FLOP metric. Starting in 2028, growth slows to an average of 5.3% per year, reaching a target of 1,035 TWh in 2035.
- Base Case Scenario (Inflection Point in 2030):
Based on the Goldman Sachs baseline, energy demand growth is projected to be stable and aggressive at 15% per year until 2030. Entering the next decade, limitations in public utility electrical grid infrastructure will begin to naturally limit the construction of new facilities. The growth rate then drops sharply to a range of 3.2% per year, reaching an equilibrium point of 1,250 TWh.
- Full Acceleration Scenario (Inflection Point in 2028):
This scenario assumes that AI adoption expands across various industries without constraints on electricity supply. Following the bullish projections of Goldman Sachs, consumption surges by 20% per year in the initial phase of ecosystem formation. Given the minimal assumption of utility permitting constraints, the post-2028 growth rate remains relatively high for macroeconomic infrastructure, at around 8.6% per year, reaching 1,700 TWh at the end of the projection.
Global Distribution Map and US Dominance
Currently, this physical infrastructure load is distributed asymmetrically. Based on aggregated global data up to early 2026, the United States maintains absolute dominance, hosting more than 4,165 active data center facilities, representing approximately 38% of the world’s total infrastructure.
This US scale significantly outpaces the European market, led by the United Kingdom (499 facilities) and Germany (487 facilities), as well as the Asian market, such as China (381 facilities).
This concentrated distribution means that the data center sector accounts for 8.9% of the total national electricity consumption in the United States. In specific locations that are the epicenter of computing, such as Northern Virginia (Data Center Alley), facilities consume up to 26% of the state’s total electricity - almost three times the national average.
Validation of Trends Through Investment in Construction
The projected increase in energy demand of up to 270% is validated by capital movements in the construction sector. According to data from the U.S. Census Bureau, annual spending on data center construction in the United States was $1.6 billion in early 2014.
By mid-2025, this expenditure had soared exponentially to $41.19 billion per year.
This surge in physical investment, an increase of more than 2,400% or about 25 times in the last eleven years, mathematically justifies that the IEA’s projections are not hyperbolic assumptions, but rather a reflection of ongoing infrastructure development.
This massive-scale construction is also driving an increase in demand for supporting commodities; for example, demand for copper for cables and data center cooling components worldwide is projected to increase sixfold from 0.5 million tons to 3 million tons per year by 2050.
The characteristics of AI training require a continuous flow of power with guaranteed uptime.