
West Java Trade Balance Records US$16.63 Billion Surplus for January-July 2026
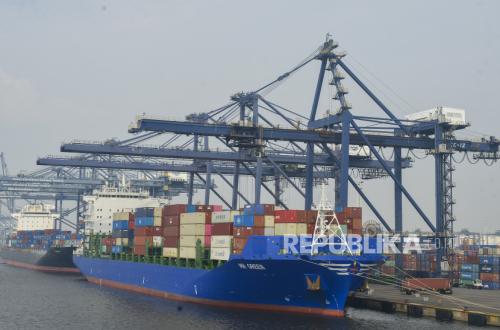
The West Java trade balance recorded a surplus of US$16.63 billion during the January-July 2026 period. This surplus was supported by export values reaching US$23.58 billion, while imports totalled only US$6.95 billion during the same period.
The Head of BPS West Java, Margaretha Ari Anggorowati, stated that West Java’s export value for January-July 2026 reached US$23.58 billion, representing a 6.43 per cent increase compared to the same period in 2025. In line with total exports, non-oil and gas exports reached US$23.40 billion, up 6.35 per cent. Similarly, oil and gas exports reached US$178.27 million, an increase of 16.85 per cent.
Among the ten commodities with the largest non-oil and gas export values for January-July 2026, the largest increase was seen in the Machinery and Mechanical Equipment group, rising by US$418.86 million (23.94 per cent). Conversely, the largest decrease occurred in the Rubber and Rubber Goods group, which fell by US$114.86 million (12.72 per cent).
The largest non-oil and gas export destinations for January-July 2026 were the United States at US$3.98 billion, followed by the Philippines at US$2.07 billion and Japan at US$1.69 billion, with these three countries contributing 33.09 per cent of the total. Meanwhile, exports to ASEAN amounted to US$6.27 billion, and exports to the Americas and Europe reached US$8.87 billion.
“Sectoral export performance for January-July 2026, compared to the same period in 2025, showed an increase in all sectors except mining. The oil and gas sector rose by 16.85 per cent; the agricultural sector rose by 18.51 per cent, and the manufacturing sector rose by 6.29 per cent, whereas the mining sector declined by 3.31 per cent,” said Margaretha during the Official Statistical News Release on Tuesday (1/9/2026).
Meanwhile, West Java’s import value for January-July 2026 reached US$6.95 billion, a decrease of 1.45 per cent compared to the same period in 2025. Non-oil and gas imports reached US$6.58 billion, up 6.35 per cent, while oil and gas imports reached US$376.54 million, down 56.80 per cent.
Among the ten commodities with the largest non-oil and gas import values for January-July 2026, the largest decrease was in the Machinery and Mechanical Equipment group by US$138.48 million (22.23 per cent). The largest increase was in the Electronic Machinery and Equipment group by US$245.44 million (25.92 per cent).
The largest supplier of non-oil and gas imports during January-July 2026 was China, valued at US$2.78 billion (42.14 per cent), followed by Japan at US$788.98 million (11.99 per cent), and South Korea at US$779.07 million (11.84 per cent).
Regarding import values for January-July 2026 by usage category, consumer goods rose by 5.73 per cent, while raw/auxiliary materials and capital goods decreased by 1.04 per cent and 9.84 per cent respectively, compared to the same period the previous year.