
PMI Differences Test the Real Portrait of Manufacturing
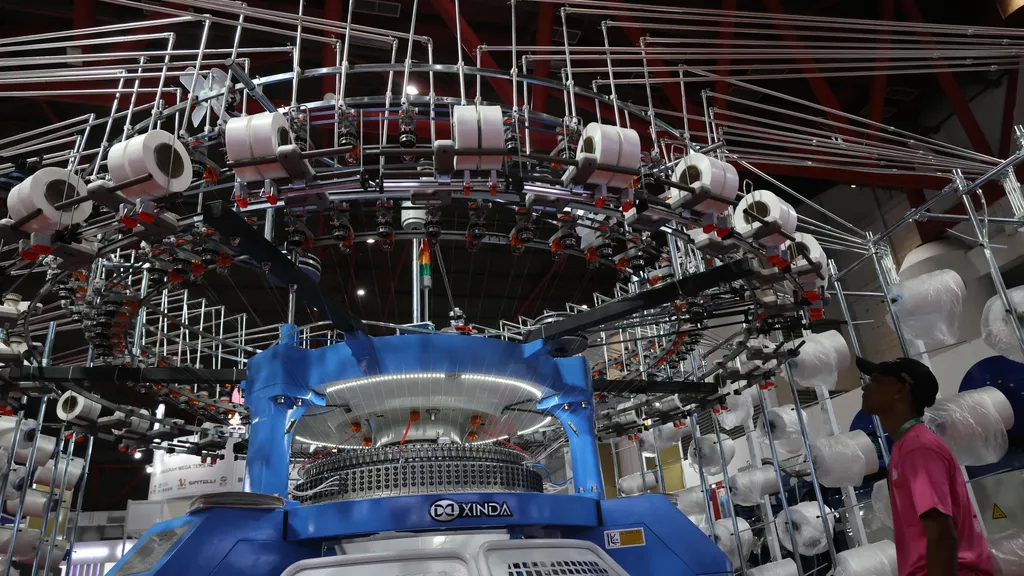
The S&P Global PMI data showed a contraction of 46.9, while the Bank Indonesia PMI showed an expansion of 51.43.
KOMPAS/TOTOK WIJAYANTO
By Aguido Adri
22 Jul 2026 07:00 WIB · Ekonomi & Bisnis
Data on Indonesia’s manufacturing performance based on S&P Global and Bank Indonesia shows significantly different indices. The assessment by S&P Global indicates a considerable contraction. Meanwhile, the assessment by Bank Indonesia shows expansion. What distinguishes the results of these two surveys?
Data from the S&P Global Purchasing Managers’ Index (PMI) indicates that Indonesia’s manufacturing PMI fell from 50.0 in May 2026 to 46.9 in June 2026. This signifies a significant contraction and indicates the largest decline in operational conditions in a year.
The decline was also influenced by weakened new demand, both from the domestic market and exports, which impacted the reduction of production activities, raw material purchases, and labor absorption.
On the other hand, the industry is also facing a surge in production costs due to rising raw material prices and currency depreciation. Input price inflation has been recorded as the second highest since the PMI survey began in 2011.
Meanwhile, the Prompt Manufacturing Index (PMI) survey by Bank Indonesia recorded a PMI-BI of 51.43 in the second quarter of 2026, remaining above the expansion threshold of 50, although lower than the previous quarter’s figure of 52.03.
The main support for the expansion still comes from three main components. First, the production volume reached 53.81 (down from the first quarter, 54.07). Second, the finished goods inventory volume was 53.00 (down from the first quarter, 54.43 percent). Third, the total order volume was 52.77 (down from 53.20 percent).
Bank Indonesia estimates that manufacturing activity will strengthen again in the third quarter of 2026, with the BI PMI reaching 52.32.
However, of the five components that make up the PMI-BI, two strategic indicators remain in the contraction zone, namely the speed of receipt of input goods, which fell to 47.46, and the number of workers, which fell to 48.65.
From the subsector perspective, expansion is still dominated by industries that have long been the driving force of national manufacturing. The machinery and equipment industry recorded the highest index at 58.24, followed by the food and beverage industry at 54.05, the basic metal industry at 53.59, and the non-metallic mineral products industry at 53.22.
Conversely, several subsectors are still facing pressure. The tobacco processing industry remains in a contraction phase with an index of 45.50, as does the chemical, pharmaceutical, and traditional medicine industry (49.68), the metal goods, computer, electronics, optics, and electrical equipment industry (48.55), as well as the furniture industry (48.94).
In response to the differences in the manufacturing performance index, senior economist from Paramadina University, Wijayanto Samirin, assessed that historically, the PMI from Bank Indonesia tends to be more conservative compared to the PMI from S&P Global. Conversely, the S&P PMI is more sensitive to changes in business conditions.
“If we look at the conditions throughout the second quarter, oil prices and their derivatives surged due to the Gulf War, global supply chains were disrupted, the rupiah fluctuated, inflation increased, the trend of layoffs rose, credit growth slowed, and the retail index also declined. In such a situation, the S&P PMI better reflects the conditions on the ground,” he stated when contacted separately, Tuesday (21/7/2026).
According to Wijayanto, the results of the Bank Indonesia survey, which still indicate expansion, are becoming less aligned with various other economic indicators that suggest a slowdown in activity.
However, he reminded that the two indexes cannot be compared directly because they were built using different methodologies.
Bank Indonesia’s PMI is a composite index compiled from the quarterly Business Activity Survey (SKDU) of approximately 600 businesses. This index combines five components: production volume, total orders, finished goods inventory, labor, and the speed of receipt of input goods.
Meanwhile, the S&P Global PMI is compiled monthly through a survey of approximately 400 purchasing managers. This group of respondents is considered the first to perceive changes in raw material demand, orders, and production plans before they are reflected in official company reports.
“The S&P PMI has a shorter time lag. The respondents are purchasing managers who are aware of changes in conditions earlier than company management, which generally relies on official reports,” Wijayanto said.
In addition to a higher frequency of surveys, S&P Global’s methodology is also uniformly applied across various countries, allowing for cross-country comparisons and becoming one of the indicators widely used by international investors to gauge economic direction.
Therefore, according to Wijayanto, the S&P PMI has more value as an early indicator (leading indicator) of manufacturing conditions.
“The Bank Indonesia PMI remains useful. However, in many aspects, the S&P PMI is superior. Given the various economic turbulence that occurred throughout the second quarter, it would be somewhat counterintuitive to see the manufacturing sector continue to expand, as reflected in the Bank Indonesia PMI,” he said.
Regardless of the differing results of the two surveys, Wijayanto believes that both convey the same message regarding the labor market. Both the PMI of Bank Indonesia and the PMI of S&P indicate that employment indicators remain weak.
PMI-BI recorded that the labor index is below the expansion level, while the S&P survey indicates that companies are accelerating workforce reductions in line with declining orders and production.
According to Wijayanto, this condition indicates that the manufacturing downturn is not over and has the potential to continue into the second half of thi