
Indonesia's Trade Balance Slips into Deficit, Coal and Palm Oil Under Pressure
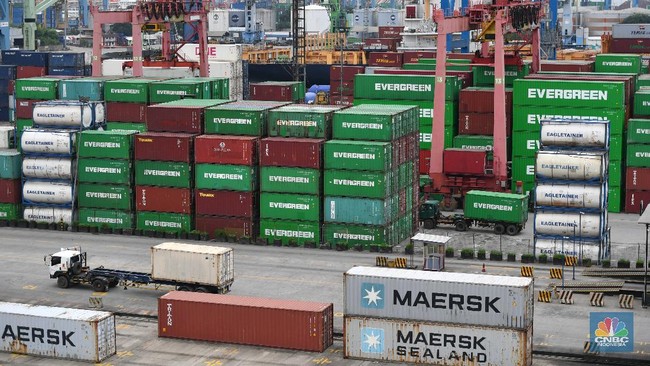
Jakarta, CNBC Indonesia - Indonesia’s trade balance has returned to the red after six years of surplus. The Central Statistics Agency (BPS) recorded a trade deficit of US$1.61 billion in May 2026. The deficit occurred because the export value was recorded at US$23.20 billion, while imports reached US$24.81 billion. This marks the first deficit since April 2020, officially breaking a 72-month surplus streak that began in May 2020. The May 2026 deficit is also the deepest since April 2019, when Indonesia posted a trade deficit of US$2.33 billion.
The primary cause of the May 2026 trade deficit was a sharp annual increase in imports. BPS noted that Indonesia’s imports in May 2026 reached US$24.81 billion, up 22.16% compared to May 2025. This increase remained significant despite a slight monthly decline of 1.59% from April 2026, indicating sustained import pressure compared to the previous year. The surge in imports was mainly driven by oil and gas. BPS recorded that oil and gas imports in May 2026 rose 70.78% year-on-year to US$4.51 billion. This increase largely stemmed from imports of refined petroleum products, which soared 99.49% year-on-year to US$3.81 billion. The rise in oil and gas imports aligns with global oil prices, which were pushed up by conflict in the Middle East, thereby inflating Indonesia’s energy import bill, particularly for fuel and refined products. In terms of usage, the import increase was broad-based. Imports of raw materials and auxiliary goods rose 25.17% year-on-year to US$17.58 billion, consumer goods rose 21.99% to US$2.23 billion, and capital goods rose 12.70% to US$5.00 billion. The rise in raw material imports indicates robust domestic demand. However, high energy and raw material import needs make the trade balance vulnerable when exports fail to keep pace.
On the other side, Indonesian exports experienced a decline. BPS recorded the export value for May 2026 at US$23.20 billion, down 8.30% compared to April 2026 and down 5.73% compared to May 2025. Pressure was also evident in non-oil and gas exports, which were recorded at US$22.45 billion in May 2026, down 7.05% month-on-month and 4.50% year-on-year. Within Indonesia’s non-oil and gas export structure, the two largest commodity groups are animal/vegetable fats and oils and mineral fuels. The animal/vegetable fats and oils group includes CPO and its derivatives, while mineral fuels include commodities like coal. BPS noted that exports of animal/vegetable fats and oils (HS 15) were the largest contributor to non-oil and gas exports during January-May 2026, with a value of US$14.06 billion, contributing 12.76% to total non-oil and gas exports. However, in May 2026, exports of this group fell sharply. The value plunged from US$3.07 billion in April 2026 to US$2.24 billion in May 2026, a month-on-month decline of 26.85% and a year-on-year decline of 14.23%. One pressure point for palm oil is the increasing domestic demand for the biodiesel programme. The government raised the mandatory biodiesel blend from B40 to B50 starting 1 July 2026, meaning the portion of palm oil-based biofuel in diesel will increase from 40% to 50%. While this policy aims to reduce dependence on imported fuel, particularly diesel, it has another consequence: greater domestic absorption of CPO and its derivatives, which could reduce export volumes.
Meanwhile, the mineral fuels group (HS 27) is the second-largest contributor to non-oil and gas exports. Its value reached US$13.18 billion during January-May 2026, contributing 11.96% to total non-oil and gas exports. Unlike CPO, mineral fuel exports actually rose in May 2026. The value increased from US$2.75 billion in April 2026 to US$3.04 billion in May 2026, a month-on-month increase of 10.49% and a year-on-year increase of 15.31%. However, this increase does not yet indicate solid strengthening throughout the year. Cumulatively, mineral fuel exports for January-May 2026 slowed, rising only 0.23% compared to the same period the previous year. This slowdown may be related to adjustments in the 2026 Coal Work Plan and Budget (RKAB), which was lowered. The Ministry of Energy and Mineral Resources previously stated that the national coal production target for 2026 was cut to around 600 million tonnes, down from the 2025 realisation of approximately 790 million tonnes. Additionally, the domestic market obligation (DMO) policy for coal, which requires companies to secure supply for domestic needs before exporting, could also limit export volumes. Export pressure was also visible in the iron and steel goods group (HS 72). The export value of iron and steel fell from US$2.50 billion in April 2026 to US$2.39 billion in May 2026, a month-on-month decline of 4.54% and a year-on-year decline of 14.68%. Iron and steel is the third-largest contributor to Indonesia’s non-oil and gas exports during January-May 2026, with a value of US$11.42 billion, contributing 10.37% to total non-oil and gas exports. Exports to Indonesia’s main markets also fell sharply. Non-oil and gas exports to China, Indonesia’s largest export market, declined.