
Indonesian Imports Surge, Eroding July 2026 Trade Surplus
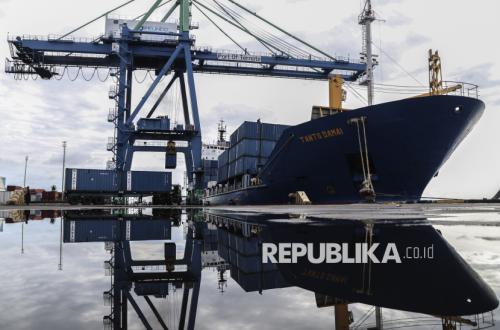
Indonesia’s trade balance in July 2026 continued to record a surplus, but its value was pressured by a surge in imports. The Central Bureau of Statistics (BPS) recorded a trade surplus of 130 million USD, with export values at 26.22 billion USD and imports at 26.09 billion USD.
Ateng Hartono, Deputy for Distribution and Services Statistics at BPS, stated that the export value in July 2026 rose by 6.05 per cent year-on-year (yoy). This increase was primarily supported by non-oil and gas exports, which reached 25.43 billion USD, while oil and gas exports were recorded at 0.79 billion USD.
“In July 2026, the export value reached 2み22 billion USD, an increase of 6.05 per cent compared to July 2025. Oil and gas exports were recorded at 0.79 billion USD, a decrease of 14.58 per cent, whereas non-oil and gas exports saw an increase of 6.84 per cent, reaching 25.43 billion USD,” Ateng said during a press conference at the BPS Building in Jakarta on Tuesday (1/9/2026).
The year-on-year increase in non-oil and gas exports originated mainly from several key commodities. Mineral fuel exports (HS27) rose by 34.86 per cent, contributing 3.41 per cent to the total export increase, while iron and steel (HS74) increased by 20.31 per cent, contributing 1.89 per cent.
Exports of machinery, electrical equipment, and parts (HS85) also rose by 22.52 per cent, contributing 1.46 per cent to export growth.
By sector, the manufacturing industry was the largest contributor to non-oil and gas exports, valued at 21.76 billion USD. This was followed by the mining and other sectors at 3.10 billion USD, while the agriculture, forestry, and fisheries sector stood at 0.57 billion USD.
Manufacturing exports grew by 6.03 per cent annually, contributing 5.01 per cent to the export increase. This growth primarily stemmed from commodities such as organic basic chemicals and others, aluminium, copper, and iron and steel.
Meanwhile, the mining and other sectors increased by 14.85 per cent annually. Conversely, the agriculture sector’s exports declined by 1.84 per cent.
On the other hand, Indonesia’s imports in July 2026 grew significantly higher than exports. The import value reached 26.09 billion USD, representing a 27.02 per cent increase year-on-year.
“In July 2026, the total import value reached 26.09 billion USD, an increase of 27.02 per cent compared to June 2025. Oil and gas imports were 3.77 billion USD, up 49.91 per cent (yoy). Meanwhile, non-oil and gas imports were recorded at 22.33 billion USD, an annual increase of 23.83 per cent,” Ateng explained.
The increase in imports was primarily driven by non-oil and gas imports, which provided the largest contribution to import growth.
Based on the category of goods usage, the import of raw materials or auxiliary materials was the main driver, increasing by 32.33 per cent annually and contributing 22.31 per cent to import growth. Capital goods imports rose by 17.38 per cent, while consumer goods increased by 10.50 per cent.
Cumulatively, Indonesia’s trade balance from January to July 2026 still recorded a surplus of 3.70 billion USD. This surplus was supported by a non-oil and gas trade surplus of 22.45 billion USD, while the oil and gas trade experienced a deficit of 18.75 billion USD.
“The surplus throughout the January-July 20ng period was supported by the performance of non-oil and gas commodity trade, which recorded a surplus of 22.45 billion USD, while oil and gas commodity trade still experienced a deficit of 18.75 billion USD,” Ateng explained.
The cumulative export value for January-July 2026 reached 167.03 billion USD, up 4.43 per cent compared to the same period the previous year. Non-oil and gas exports contributed 160.01 billion USD, growing by 5.21 per cent.
The manufacturing industry was the sector with the largest export value, at 137.26 billion USD, an increase of 7.16 per cent annually.
China remained the primary destination for Indonesia’s non-oil and gas exports, with a value of 40.62 billion USD (25.39 per cent). This was followed by the United States at 19.19 billion USD (11.99 per cent) and India at 11.00 billion USD (6.87 per cent).
Meanwhile, the cumulative import value for January-July 2026 reached 163.33 billion USD, up 19.94 per cent compared to the same period last year. Non-oil and gas imports rose by 16.78 per to 137.56 billion USD, while oil and gas imports increased by 40.24 per cent to 25.77 billion USD.
Based on usage, imports of raw materials or auxiliary materials reached 116.70 billion USD, up 20.42 per cent. Capital goods imports were recorded at 32.46 billion USD, up 20.00 per cent, while consumer goods reached 14.16 billion USD, an increase of 16.03 per cent.
“China remains the main country of origin for Indonesia’s non-oil and gas imports throughout January-July 2026, with a value of 58.29 billion USD (42.38 per cent). The next positions were held by Japan at 7.71 billion USD (5.61 per cent) and Australia at 6.47 billion USD (4.70 per cent),” he said.
Furthermore, the non-oil and gas trade surplus for January-July 2026 primarily came from animal and vegetable fats and oils at 20.96 billion USD, mineral fuels at 16.39 billion USD, iron and steel at 10.32 billion USD, nickel and its products at 7.08 billion USD, and footwear at 3.84 billion USD.