
Gold Ratios as a Compass for Reading Global Economic Direction Amid Inflation
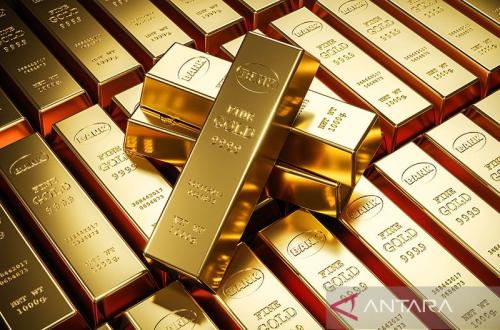
The world is currently in a phase of severe economic turbulence. Macroeconomic uncertainty, geopolitical tensions, and uncontrolled money printing by global central banks have triggered persistent inflation. This volatility is clearly manifested in commodity markets, with the gold price touching an all-time high of 5,626 US dollars per ounce in January this year.
Market participants need objective indicators to see the real value of an asset. One fundamental instrument that is back in the spotlight is the Gold Ratio. This ratio works by comparing the price of gold against other assets, such as silver, crude oil, and equities, thereby eliminating the ‘noise’ caused by short-term currency fluctuations.
Financial market analyst Kar Yong Ang asserts that in the current economic landscape, the dynamics of the gold price cannot be separated from global monetary authorities. ‘In the medium to long term, the gold price is largely driven by monetary policy, with the Federal Reserve and the strength of the US dollar remaining the dominant factors,’ he said in a press release on Friday (10/7/2026).
According to Kar Yong Ang, in financial theory, a ratio is a mathematical relationship showing how many units of one asset are needed to buy one unit of another asset. Unlike absolute prices, which are often distorted by inflation, ratios provide a pure perspective on the relative performance between assets. Gold, as a neutral tangible asset proven to be inflation-resistant, is often used as a fundamental anchor to measure other financial assets.
This ratio functions not only as an analytical tool but also as a flexible trading instrument. ‘In trading, ratios help identify trends, divergences, and mean reversion opportunities. When trading via CFDs (Contracts for Difference), understanding these ratios opens up opportunities for statistical arbitrage,’ said the Financial Market Analyst at Elev8.
To read the health of the global economy, there are three variations of the gold ratio most frequently used by analysts and traders.
- Gold-to-Silver Ratio (GSR)
The Gold-to-Silver Ratio is one of the oldest exchange rate metrics in the world. Although both are precious metals, their demand characteristics are very different. Gold is dominated by its monetary function and central bank reserves, whereas silver is heavily dependent on manufacturing activity.
Regarding these differing characteristics, Kar Yong Ang stated that silver is far more sensitive to the economic cycle than gold because the investment thesis for silver is less clear, while its industrial use is broader. ‘Silver is a quasi-industrial precious metal, whereas gold still has an important monetary function,’ he said.
When this ratio spikes far above its historical average, it signals that the price of silver is undervalued relative to gold, which often opens up pair trading opportunities (buying silver and selling gold simultaneously).
- Gold-to-Equities Ratio
This metric values major stock indices, such as the S&P 500 or Dow Jones, in units of gold ounces. The ratio provides a picture of whether global capital is flowing into paper assets (stocks) or returning to tangible hard assets.
Historically, the equities-to-gold ratio peaks every 35 to 40 years, such as in the late 1920s, mid-1960s, and late 1990s. After reaching these peaks, the stock market typically experiences a bear market for years, while gold undergoes significant price acceleration. A bear market is a financial market condition where asset prices (such as stocks or crypto) experience a significant decline of more than 20 per cent from their highest point over a certain period.
- Gold-to-Oil Ratio
Measuring the price of crude oil against gold is considered one of the most valid instruments for projecting an economic recession. Since 1972, this ratio has generally moved stably around the number 20. However, geopolitical dynamics or OPEC decisions that trigger oil price spikes will depress this ratio.
A structural decline in the gold-to-oil ratio of 20 per cent to 30 per cent from its peak is often considered an early indicator of a slowdown in global economic activity and a major recession in the United States.