
Coal Exports Worth Rp341 Trillion: How Much Does the Government Receive?
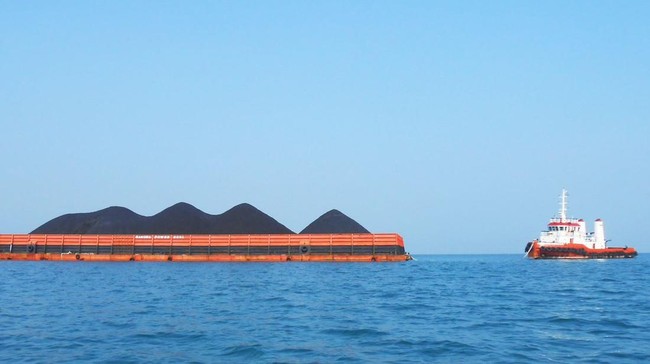
Jakarta, CNBC Indonesia — Indonesia’s coal export performance showed an anomaly in January–September 2026. Although shipment volumes fell by double digits, the value of exports still recorded positive growth.
Statistics Indonesia (BPS) data show that Indonesia exported 255.05 million tonnes of coal, down 10.58% from 285.23 million tonnes in the same period last year.
By contrast, export value rose 4.86% to US$18.81 billion, or about Rp341.2 trillion, based on an exchange rate of US$1 to Rp18,138.
India and China accounted for US$6.78 billion, or about Rp123 trillion, equivalent to 36% of the total.
The increase in value was driven by a sharp rise in coal prices. Refinitiv data put the average price in January–September 2026 at US$132.30 a tonne, up from US$108.33 a tonne in January–September 2025.
The price surge was prompted by rising oil and gas prices, India’s electricity crisis and a mine explosion in China.
India and China remain the main markets
India remained the largest destination for Indonesian coal exports, receiving 64.66 million tonnes in January–September 2026. However, shipments fell 17.23% year on year, while export value edged up just 0.66% to US$3.89 billion.
The decline came as India needed more coal for power generation. Reuters reported that coal imports for India’s power sector surged 85.6% to 5.52 million tonnes in August 2026, their highest level in 15 months. About 80% came from Indonesia.
Demand increased as electricity consumption rose in hot weather and hydropower generation weakened. Pressure continued in September, when India’s electricity supply deficit reached 560 million kilowatt-hours (kWh), the highest since August 2023.
Coal-fired power generation rose 13.3% year on year. Despite the increase in imports, Indonesian coal shipments to India fell 7.75% in September to 8.24 million tonnes. This suggests that the surge in imports for India’s power sector had not yet translated into higher overall coal shipments from Indonesia.
China was the second-largest market, with exports of 40.90 million tonnes, down 21.28% in January–September 2026. The decline steepened in September, when shipments plunged 57.45% to 3.31 million tonnes.
Together, India and China took about 41% of Indonesia’s total coal export volume, making the downturn in both markets a significant drag on export performance.
Exports to Japan also fell, by 4.37% to 17.59 million tonnes. However, their value rose 4.59% to US$2.07 billion.
Japan still needs coal to safeguard electricity supplies, particularly as liquefied natural gas (LNG) prices rise amid conflict in the Middle East. The International Energy Agency (IEA) expects Japan’s thermal coal imports in 2026 to remain at about 124 million tonnes after revising its forecast upwards.
Bangladesh, meanwhile, is relying increasingly on coal amid declining domestic gas production and limited LNG supplies. Reuters reported that weakening gas output has made it difficult for gas-fired power plants to meet demand.
The Philippines, by contrast, recorded an increase. Export volumes to the country rose 2.41% to 29.17 million tonnes, while their value grew 21.27% to US$2.04 billion.
The Philippines’ reliance on imports is linked to limited domestic supply. Output cuts by the country’s largest coal producer have also driven imports higher.
The Philippine government has sought assurances of supply from Indonesia and begun exploring alternative suppliers, including the United States, Russia and Australia, to reduce the risk of dependence.
Overall, the value of Indonesia’s coal exports in September 2026 reached US$2.22 billion, up 9.16% on the same period a year earlier.
However, shipment volume fell 19.81% to 27.35 million tonnes. The rise in value despite lower volumes indicates higher average receipts per tonne, but was not enough to offset the decline in shipments.
How much does the state receive?
With export value exceeding Rp341.2 trillion in January–September, non-tax state revenue (PNBP) from non-oil and gas natural resources reached Rp132.2 trillion over the period.
That means less than half the export value was reflected in PNBP receipts.
The disparity between export value and PNBP was also apparent in 2025.
In 2025, export value comprised Rp445.56 trillion of coal and Rp104.04 trillion of lignite. Adding estimated domestic sales of Rp314.53 trillion brings the estimated total to Rp864.13 trillion.
The US$70-a-tonne figure does not mean all domestic consumers actually bought coal at that price. It reflects a rule capping the domestic market obligation (DMO) price for uses such as power generation at US$70 a tonne. Actual prices depend on coal quality and calorific value, intended use, applicable requirements and sales contracts.
How does PNBP compare with sales value?
Once the scale of sales is established, state receipts can be compared separately. From 2016 to 2025, realised mineral and coal PNBP totalled Rp896.29 trillion.
This comparison is indicative because the figures cover different things. Mineral and coal PNBP includes minerals as well as coal, and excludes taxes. The comparator covers coal and lignite sales only; its domestic component is a simulation, and sales of mineral commodities are not included in the total.
If total mineral commodity sales were included, the share of PNBP in total mineral and coal sales would likely be lower still.
The scale of sales therefore underscores the importance of oversight to ensure companies meet their obligations under the rules and that the state’s share is optimised for public welfare.
Export prices far below international benchmark series
Price differences are another issue requiring scrutiny. The implied export price is calculated by dividing the FOB value of exports by their weight, while the NCFMc2 series is based on average daily price observations used globally.
In 2025, the combined implied export price was US$57.63 a tonne, compared with an average of US$108.52 a tonne for the NCFMc2 series. The previously calculated figure of US$62.62 a tonne covered coal only and excluded lignite.
The gap should be assessed using comparable quality, transaction periods and delivery terms. Differences in quality can produce a wide range of prices. For example, the second-period April 2025 Coal Benchmark Price (HBA) was US$120.20 a tonne for 6,322 GAR coal, while the price for the 3,400 GAR category was US$34.32 a tonne.
The price gap is therefore a reason for further examination, but is not, on its own, evidence of state losses or wrongdoing by any particular company.
Profits rise at five listed companies
At company level, PT Adaro Andalan Indonesia Tbk (AADI), PT Bayan Resources Tbk (BYAN), PT Golden Energy Mines Tbk (GEMS), PT Bumi Resources Tbk (BUMI) and PT Bukit Asam Tbk (PTBA) all reported growth in net profit attributable to owners of the parent in the first half of 2026.
Their combined profit reached Rp23.81 trillion, up 31.40% from Rp18.12 trillion in the first half of 2025.
Comparing net profit and royalties with revenue
To examine the relationship between revenue, profits and royalty payments, the following comparison uses FY2025 figures.
The comparison shows differing results among companies. At BYAN, net profit attributable to the parent was equivalent to 22.40% of revenue, while royalty payments were equivalent to 7.69%.
At AADI, GEMS, PTBA and BUMI, the available figures for government payments show that the royalty/PNBP ratio was higher than the ratio of net profit attributable to the parent.
How much is paid after tax is included?
Royalties and PNBP form part of companies’ fiscal contributions. Tax payments need to be shown separately to provide a more complete picture.
AADI’s Rp14.53 trillion figure represents royalty and PNBP payments, while its income tax payment is reported separately at Rp3.72 trillion.
Gross payments should also be considered alongside tax refunds. In 2025, reports recorded tax refunds of about Rp3.41 trillion for AADI, Rp6.53 trillion for BYAN and Rp2.12 trillion for PTBA. The type and tax period must be matched before calculating net state receipts.
For BUMI, KPC is recorded as a joint venture using the equity method. KPC’s tax and royalty payments are therefore not included in BUMI’s consolidated cash flow. As a result, the table does not show the total contribution from all KPC and Arutmin operations.
Profit growth should be matched by certainty over the state’s entitlements
Higher profits at the five listed companies point to improved performance among the sample. For the government, this is relevant to monitoring companies’ ability to meet their obligations and ensuring that the bases used to calculate tax and royalties are reported accurately.
The estimated scale of sales provides a strong reason to tighten the reconciliation of production, coal quality, shipments, selling prices and payments due. The difference between revenue and tax and PNBP also funds production, labour, transport, investment and other obligations.
The listed companies’ profits are rising and their businesses are large. The government has an interest in ensuring that all state entitlements are paid in full. Scrutiny of price fairness and payment compliance is essential to optimising revenue from Indonesia’s natural resources.
Source: jawawa.id (https://jawawa.id/newsitem/coal-exports-worth-rp341-trillion-how-much-does-the-government-receive-1794289848)
Originally published by CNBC Indonesia (https://www.cnbcindonesia.com/research/20261110094937-128-783840/ekspor-batu-bara-rp341-t-pengusaha-kaya-pemerintah-dapat-berapa), translated from Indonesian