
Check Bali’s Air Quality Using the IQAir App
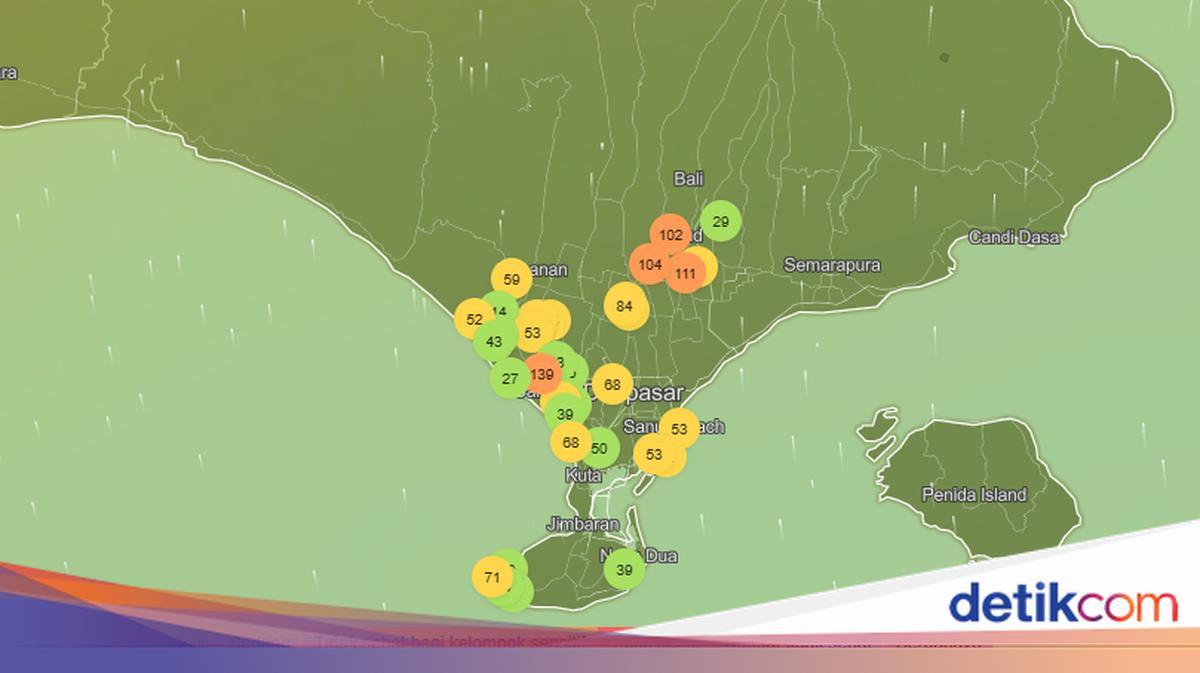
Air quality is one of the things people should check before going outdoors, whether they are commuting to work, exercising or holidaying in Bali. Recently, air conditions have worsened amid widespread air pollution, smoke and dust.
Continuing deterioration in air quality poses short- and long-term health risks, including acute respiratory infections (ARI), asthma and lung cancer. People are therefore advised to monitor the air around them more actively and take preventive measures early.
The public can use the IQAir app to check air conditions near their homes. It provides the Air Quality Index (AQI), pollutant concentrations and air-quality forecasts.
About the IQAir app
IQAir is an air-quality monitoring app developed by a Swiss company to improve air quality and public health worldwide. It provides real-time air-pollution data and forecasts for up to seven days, and is integrated with air-purification devices at more than 500,000 locations. The app helps users assess pollution levels in an area by detecting harmful particles and presenting the findings in numerical data and on a map.
IQAir’s air-quality monitoring features
Users can access a range of information about air quality, as well as health recommendations. Key features include real-time air-quality and weather data, seven-day pollution forecasts, a panoramic map of global pollution levels and rankings of the world’s most polluted areas.
The app also provides news and advice on reducing health risks from exposure to unhealthy air. It can issue alerts when outdoor air quality falls below health standards.
How to check Bali’s air quality using IQAir
People can use the IQAir mobile app to check air quality in Bali. The steps are as follows.
Download the IQAir app. Open Google Play Store on an Android device or the App Store on an iPhone. Search for IQAir or IQAir AirVisual, then download and install the app.
Open the app. Once installed, open IQAir and enable access to your current location. The app will show air-quality information for the user’s surrounding area. You can also search for a location manually.
Search for an area in Bali. Enter the area’s name in the search bar to see air-quality information for that location.
Select a monitoring location. Check the list of locations or monitoring stations displayed, then select the one that best matches the area you want to check.
Check the air-quality index. After selecting a location, review the AQI figure, air-quality category, PM2.5 concentration if available, and the time the data was last updated.
View the forecast and recommendations.
How to read the AQI
The Air Quality Index (AQI) describes air quality and its potential effects on health. The IQAir app uses the United States AQI scale, which is divided into six categories:
Good: green, AQI 0–50.
Moderate: yellow, AQI 51–100.
Unhealthy for sensitive groups: orange, AQI 101–150.
Unhealthy: red, AQI 151–200.
Very unhealthy: bright purple, AQI 201–300.
Hazardous: dark purple, AQI above 300.
The higher the AQI, the greater the air pollution and its potential health impact. IQAir also displays PM2.5 concentrations. These are very small pollution particles that can travel deep into the lungs when inhaled. In addition to the AQI, users can check PM2.5 levels for a clearer picture of local air pollution.
Bali’s best and worst air quality
According to IQAir monitoring on 21 October 2026, air quality across Bali was generally in the moderate category, with AQI readings below 100.
Seminyak had the best air quality, with an AQI of 11. Nusa Dua ranked second, followed by Gianyar. Denpasar also had good air quality, with an IQAir reading of 45.
The three areas with the highest AQI readings were Ubud at 94, Sukasada at 86 and Badung at 79. All three were in the moderate category, shown in yellow.
Yellow indicates that air quality is generally acceptable, but sensitive groups — including people with respiratory conditions, children and older people — should pay closer attention to air conditions when outdoors.
IQAir readings can change over time as conditions are monitored in real time.