
BPS reports 16.56 per cent increase in East Java imports from January to July 2026
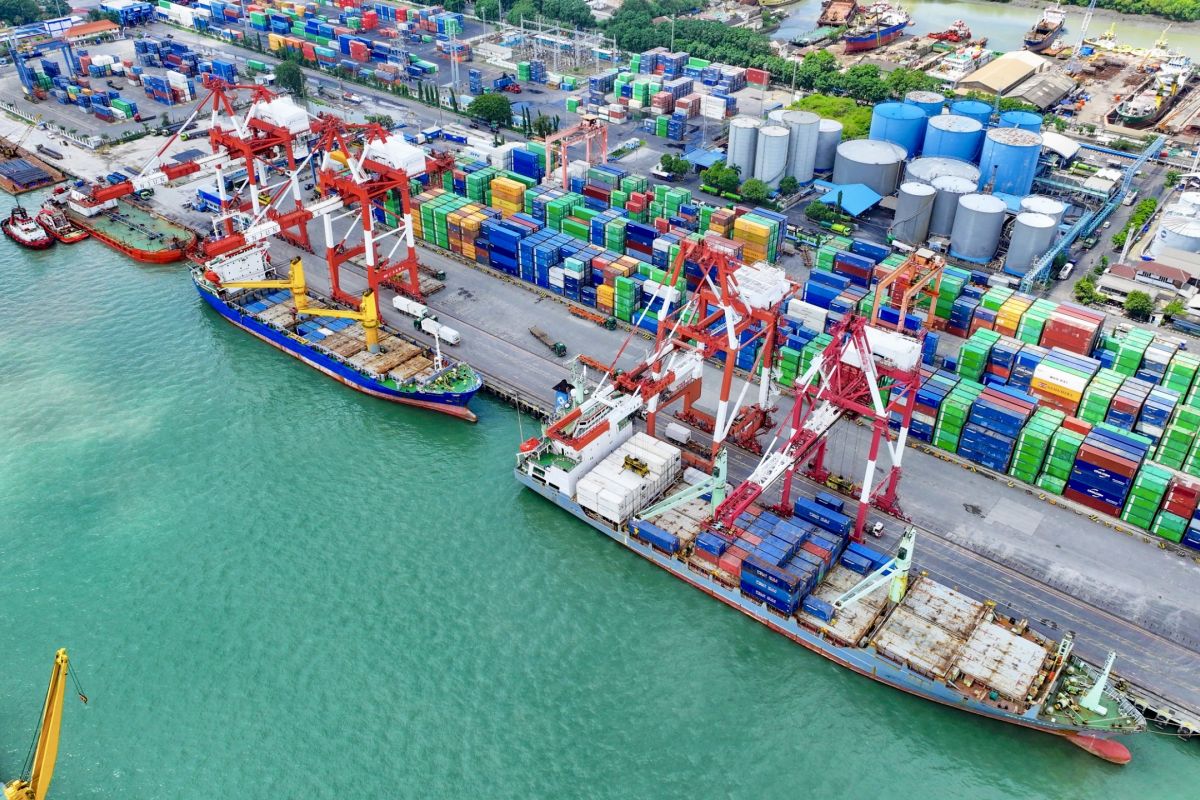
The Central Bureau of Statistics (BPS) recorded that the import value for East Java from January to July 2026 reached $19.52 billion, an increase of 16.56 per cent compared to the same period in the previous year.
“In line with this, both oil and gas and non-oil and gas import values have risen,” said the Acting Head of BPS East Java, Herum Fajarwati, in Surabaya on Tuesday.
The 16.56 per cent increase in East Java’s import value, rising from $16.74 billion in 2025 to $19.52 billion, was triggered by a strengthening in the non-oil and gas sector, which grew by 14.16 per cent from $13.94 billion to $15.91 billion.
Oil and gas imports also rose by 28.48 per cent, from $2.81 billion to $3.61 billion, with crude oil imports increasing by 22.34 per cent from $317.07 million to $387.90 million. Similarly, imports of refined oil products experienced an increase of 30.53 per cent, rising from $1.80 billion to $2.35 billion.
For July 2026 specifically, East Java’s imports reached $3.01 billion, a 19.5 per cent increase compared to July 2025. Non-oil and gas imports were recorded at $2.52 billion, up 22.3 per cent, while oil and gas imports stood at $0.49 billion, up 6.8 per cent compared to July 2025.
Among the ten commodities with the highest non-oil and gas import values from January to July 2026, the highest increase was seen in fruit (HS 08) at $214.49 million, a 35.87 per cent rise, the majority of which originated from China, totalling $740.29 million.
Other commodities experiencing significant increases included iron and steel (HS 72) by $245.05 million, or 28.04 per cent, and fertilisers (HS 31) by $181.31 million, or 26.88 per cent, compared to the same period in 2025.
Iron and steel (HS 72) were primarily imported from China, reaching $659.72 million, while fertilisers were mostly imported from the Russian Federation, amounting to $268.11 million.
Meanwhile, machinery and mechanical equipment (HS 84), the largest contributor to imports, also rose by 13.70 per cent from $1.47 billion to $1.67 billion, with the majority originating from China at $872.82 million.
From January to July 2026, imports from these ten commodity groups (HS 2-digit) contributed 58.61 per cent to the total non-oil and gas imports. In terms of growth, these ten commodity groups saw an increase of 16.08 per cent compared to the same period in 2025.