
Behind the QRIS Sound: Reading Invisible Purchasing Power
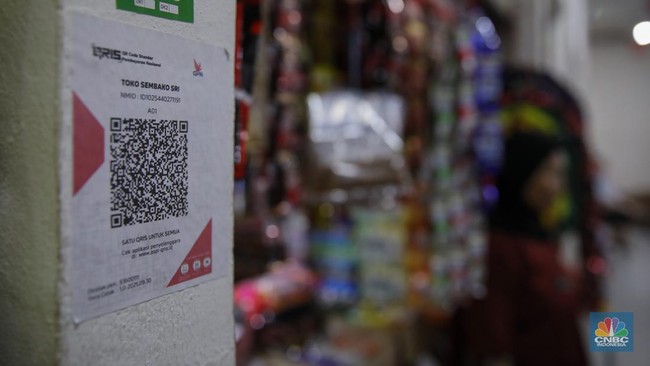
There is a small sound becoming increasingly familiar in daily life: the ‘ting!’ notification signifying a successful QRIS transaction. This sound is heard in eateries, coffee shops, grocery stores, parking lots, and home businesses. It lasts only a second or two, but when aggregated, millions of such sounds tell a significant story about the changing face of the Indonesian economy.
Bank Indonesia (BI) recorded that QRIS transactions in the second quarter of 2026 grew by 100.12% year-on-year (yoy). During the same period, digital payment transaction volumes reached 16.07 billion transactions, a growth of 36.88%. QRIS growth remained high in July 2026 at 82.42% yoy, supported by an increase in the number of users and merchants.
At first glance, these figures are impressive. QRIS is growing at three digits, the digital economy is becoming more active, and transactions are becoming easier for the public. However, another set of figures must be considered alongside them. In the second quarter of 2026, household consumption grew by 5.06% yoy, while the overall Indonesian economy grew by 5.29%, with the Gross Domestic Product (GDP) at current prices reaching Rp6,552.1 trillion.
The question arises: if QRIS is growing by 100% while household consumption only grows by about 5%, what exactly is growing? The answer is not as simple as ‘public purchasing power is surging’.
QRIS is a payment channel, not a direct measure of purchasing power. Its growth can be influenced by the increasing number of merchants accepting digital payments, the rising number of users, and the shift of the public from cash or other payment channels to QRIS. Therefore, a surge in QRIS transactions cannot be translated one-to-one as an increase in real consumption.
For example, consider someone who paid Rp100,000 for a meal in cash last year, but pays the same amount via QRIS this year. Economically, they are not necessarily wealthier. The only thing that has changed is the payment trail: previously, money changed hands; now, data also moves.
This fact is often overlooked: digitalisation does not always create new transactions. Most of the time, it simply moves transactions from a form that is difficult to track into a form that leaves a digital footprint.
Nevertheless, this does not mean QRIS is not useful as an economic indicator. On the contrary. Household consumption is the most important component of the Indonesian economy, and BI assesses that household consumption in the second quarter remained stable, driven in part by various government stimuli such as food assistance, transport tariff reductions, and national internship and vocational training programmes.
This means there is a sufficiently strong basis to state that public consumption is indeed still ongoing. However, ongoing consumption and healthy purchasing power are not entirely identical.
Imagine three people all paying Rp500,000 via QRIS. The first person pays with newly received income, the second uses savings, and the third uses available credit facilities provided through payment service providers.
For the merchant, all three are the same: Rp500,000 is received. However, for the household’s financial condition, the stories differ. The first person uses income, the second uses previously accumulated wealth, and the third draws upon future payment capacity.
This is where the problem lies in reading purchasing power: transaction figures show the decision to buy, but they do not always show the resources that make that decision possible. This does not mean that the use of savings or credit is a bad thing.
Savings are meant to be used, while credit can help manage cash flow and finance both productive and consumption needs. The problem arises when transaction values are used solely to conclude that public welfare is automatically increasing.
Therefore, inflation data needs to be placed within the same context. The previously awaited data is now available. BPS recorded that in August 2026, inflation was 0.21% month-on-month (m-to-m), with annual inflation (y-to-d) at 1.86%, and year-on-year (y-on-y) inflation at 3.19%, with the Consumer Price Index (CPI) at 111.97. This annual inflation rate is higher than the 2.88% recorded in July 2026.
Interestingly, the price increases in August were not limited to just one or two groups. All expenditure groups experienced annual inflation. The food, beverage, and tobacco group experienced inflation of 3.86%; transport at 4.79%; food and beverage services/restaurants at 2.67%; and personal care and other services at 9.25%.
The latter group even contributed 0.63 percentage points to annual inflation, primarily due to the rise in gold jewellery prices, which contributed 0.53 percentage points.
Price pressure was also felt in commodities close to daily consumption. In August 2026, the commodities that dominated the annual inflation contribution included broiler chicken at 0.24 percentage points, fresh fish at 0.22 points, cooking oil at 0.13 points, and rice at 0.12 points. Meanwhile, in the transport group, petrol contributed 0.31 points and airfares contributed 0.12 points.
Thus, the August release provides increasingly important context for interpreting purchasing power. While digital transactions are increasing, the prices of goods and services purchased by households are also rising. A larger transaction value does not necessarily mean the volume of goods and services purchased is increasing in the same proportion.
As an illustration, if expenditure increases by 6% while the average price of goods and services also increases, the volume of goods and services purchased does not necessarily rise by 6%. Therefore, nominal consumption is not the same as real consumption, and real consumption does not automatically follow.