
3 Ways to Check Forest Fires Online, Including via Google Maps
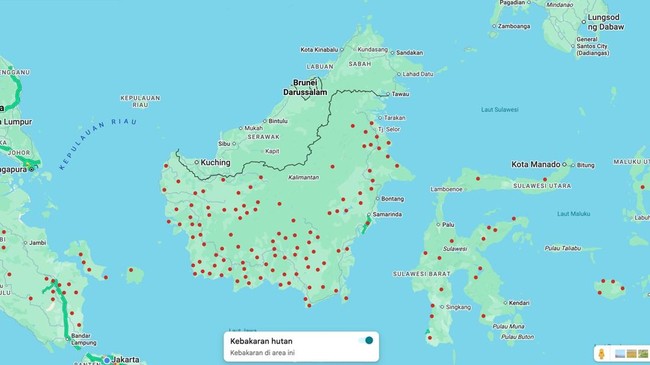
Amid the dry season and the risk of forest and land fires (karhutla) in Indonesia, the public can now play an active role in monitoring environmental conditions around them. Using satellite technology, people can detect hotspots or thermal anomalies directly from their phones.
This data is available through a number of official services that the public can access to view areas indicated as experiencing temperature anomalies. Hotspot information can help identify areas that need greater attention. This data is an early indication that still needs to be analysed and, if necessary, verified in the field.
A hotspot is a location on the earth’s surface detected by satellite sensors as having a thermal anomaly. Meanwhile, karhutla is a fire event that occurs in forest and/or land areas. Therefore, the appearance of a hotspot does not always mean that a forest or land fire has occurred.
Here are the ways and platforms to check hotspots and monitor karhutla information:
- SiPongi+ Ministry of Forestry
SiPongi+ is the Forest and Land Fire Monitoring System owned by the Ministry of Forestry. This service presents the latest hotspot data and information as well as other information related to forest fires.
How to check:
Open the SiPongi+ page at https://sipongi.gakkum.kehutanan.go.id/
Select the Hotspot Map menu to see the distribution of thermal anomalies
Zoom in on the map to the area you want to monitor
Observe the hotspot points that appear
Check the confidence level of each point
For more detailed information, open the Hotspot Distribution menu.
Select the period, province, satellite, and confidence level as needed.
On SiPongi+, colours indicate the confidence level of the hotspot.
Green or low (0-29%): low indication.
Yellow or medium (30-79%): moderate indication and needs verification.
Red or high (80-100%): high indication and needs more attention.
Even if the confidence level is high, a hotspot is still not absolute proof that a fire is ongoing. Satellite data needs to be combined with other information and, if necessary, field checks.
- BMKG Polar Hotspot Imagery
BMKG provides a Polar Hotspot Imagery service that displays the latest satellite imagery to help see hotspot locations in Indonesia. Observations are carried out during the day and night using VIIRS and MODIS sensors on several polar satellites.
How to check:
Open the page https://www.bmkg.go.id/cuaca/satelit/polar-hotspot
The page displays satellite imagery maps and periodic hotspot detection.
Search for the area you want to monitor using the search menu.
Observe the hotspot points and their distribution.
Unlike SiPongi+, the data displayed on BMKG’s Polar Hotspot Imagery page needs to be read by paying attention to location, distribution, and observation time.
BMKG explains that a hotspot is a thermal anomaly detected by satellite compared to surrounding conditions. However, hotspot points cannot be detected in areas covered by clouds or located in blank zones. This means that the absence of hotspots does not mean an area is definitely free from fires.
- Google Maps Service
In addition to government services, Google Maps can also be used as a supplement to view active fire information. Unlike SiPongi+ and BMKG, Google Maps does not display hotspot data with the same confidence level, but rather information on wildfires or ongoing fires.
How to check:
Open the Google Maps application.
Tap the Layers menu.
Select Wildfires if available.
Zoom in on the map to the area you want to monitor.
Tap the fire icon or area to view available information.
On Google Maps, fires can be displayed as fire icons or red circles. Red areas indicate the estimated area affected by active fires, while yellow areas indicate fire areas with a lower level of certainty.
Google uses data from a number of sources, including information from authorities and satellite data, as well as AI and machine learning technology to detect and monitor fires. However, the information displayed is an estimate, so fire boundaries on the map may differ from actual conditions in the field.
Understanding Hotspot and Karhutla Information
Understanding hotspot data is important so that the public does not mistakenly interpret thermal anomalies as definitive proof of karhutla. Hotspots are the result of satellite detection that can help provide an early indication, but they still have limitations.
Therefore, monitor data from official sources regularly and pay attention to the time and conditions of the area being monitored. If you see smoke or fire directly, do not approach the location and immediately report it to the authorities so that it can be followed up.